Spatial Datamining
Modelling spatial variables and practical applications
Explore, anticipate and take informed decisions with reference to models: the example of Fran+ stores
 Workshop led by Zoé Gonnon
![]()
Scenario
The Fran+ store chain is affiliated to the hyper-proximity distribution network, and already has a market presence in the department of the Hérault.
• With the objective of growing their business in neighbouring departments, Fran+ is seeking to identify prosperous areas in which to site new outlets. For the purpose of this exercise, Fran+ will identify problematic zones and high performing zones in the Herault department with the help of a tried and tested model, and then apply it subsequently to other territories. The validated model will provide a decisional tool for future sitings of new points of sale.
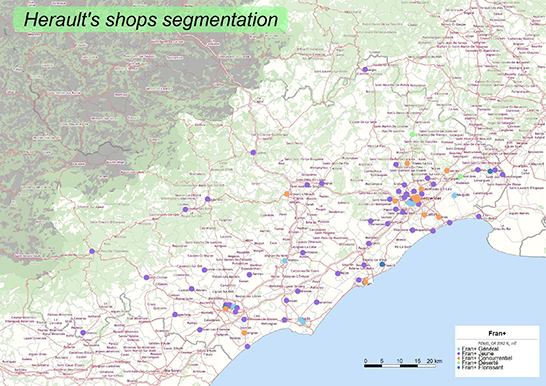
• In this context, Fran+ needs to qualify its points of sale with a view to resolving certain issues relating to distribution: this is effectively a question of adapting the product offering to the point of sale family. The store chain must draw on the characteristics of stores as well as on their sociodemographic environment to establish a typology.
The study map focuses on two departments: the Herault where the business is based and has developed historically, and Le Gard, where Fran+ hopes to expand its business.
The population density is displayed on the study maps along with the chain’s existing stores (orange logo) and those of the main competitors. The aim of our study is to explore influential factors that could be expected to have an impact on penetration rates for Fran+ points of sale, with the aim of developing the business in the zones presenting the same characteristics, using the Modeler module to do so.
Objective 1: Create and re-use a spatial model
1- 1 Defining your variables and studying the result model
- Select the variable to explain (penetration rates) as well as the variables that are considered to be explanatory (store potential, surface area, proportion of population aged 14-25, proportion of the population in a family configuration… ).
- Observe and understand correlations of variables in relation to the target variable
- Create a reliable model:
- of high quality: measure the proportion of information contained in the target variable that the other variables explain;
- robust: capacity of the model to be reproduced on another territory The larger the number of geographic objects and variables, the higher will be the quality of the model.
-> In our model, the «competitors per town», «student map proportion» and the «accesss_dist _km » indicators are the most representative of the target variable (30, 11 and 10%, this being 51% of the total dataset). This means that areas of over-performance are located in commercial areas with a high proportion of young people.
1-2 Comparative analysis: observe the pertinence of the model in terms of discrepancies between theory and reality
- Comparative analysis allows us to validate, or not, our model.
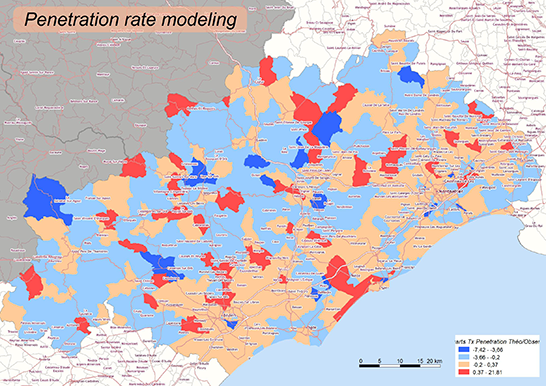
- It creates a thematic on IRIS entities for the purpose of defining those for which the model corresponds, and those which under-perform or over-perform.
- It is useful to study the profile of the IRIS entities that over-perform for future site implantations.
Our model is validated, because it exhibits high levels of robustness and quality: it may be applied to our territory, or equally, it could be transposed to apply to another territory.

1-3 Predictive analysis: apply the model to another territory
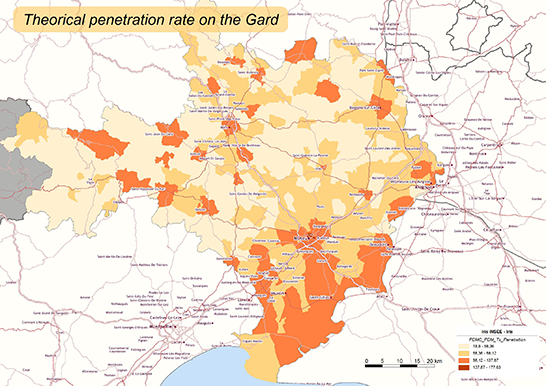
- Anticipate the theoretical performance of points of sale to be sited with the help of the model created previously.
- This is only permitted here because the model is of good quality (quality and robustness).
-> The IRIS entities of the Sud du Gard seem to be the most auspicious for the creation of new points of sale, because the theoretical penetration rate is high.
Results after the identification of relevant variables
Creating the model based on the penetration rate variable allows us to identify those factors and territorial characteristics that have most impact on its value. From this we can deduce – in terms of the store providing a service of hyper-proximity – that the presence of competitors is not limiting, but that on the contrary, contributes to a high penetration rate, because it signifies that the Fran+ stores are located in dynamic commercial zones.
Comparative analysis highlights those IRIS entities that deviate from the model. It is a useful exercise to analyse zones that over-perform, as it provides the opportunity to study the factors that influence them.
Predictive analysis informs us about the category to which a possible new store belongs: this allows us in turn to attribute a customised and specific products and/or services offering.
Objective 2: Implementing a point of sale typology
2-1 Generate a typology based on sociodemographic and business-specific variables
- From a target variable, create a series of objects sharing homogeneous characteristics (here, a typology of points of sale is created based on figures for revenue in 2012).
- Select those variables that could explain the target variable (store size, position in town centre, periphery…, sociodemographic characteristics).
- Observe the quality of the model and the variables proposed for each category to estimate the store profile.
2 - 2 Apply the typology to stores that have not yet been opened to estimate their family of affiliation
- Reload the model saved earlier and apply it to stores in another territory to forecast their profiles.

Typology as an help for grid's development
Implementing a typology enables distribution of points of sale in families, for which we display the 5 most important markers in such a way as to be able to affiliate a consumer profile to them, and adapt the product offering to each type of store.
This typology can be reapplied to non-existent (possible) points of sale, by integrating their business data and the sociodemographic data for the territory where the new outlet is to be sited.
Modeler, which purpose?
Modelling applies a hierarchy to a series of selected variables, indicating a value for each variable representing its contribution to the target variable.
Dividing involves creating groups with homogeneous characteristics based on a target variable.
The Modeler for Geoconcept module needed for this study allows us to understand, anticipate and assist with strategic decision-making, drawing on models built around business specific and sociodemographic variables.


