WHAT'S NEW IN TERRITORY MANAGER?

Find out here about the latest new features in the Territory Manager application: Spring '24Fall '23Summer '23Spring '23Fall 2022Summer 2022Spring 2022Summer 2021, Winter 2021, Summer 2020, Winter 2019, version 6 et version 5.

Version Spring '24 - minor update of 25/06/2024

Consistency of how table actions behave on the selection list

The selection list can be filtered, and among the lines displayed, some can be checked and others not.
Some actions in the table (Create a territory, Assign) only used the checked and visible (i.e. filtered) rows. But others (Cancel the assignment, Delete the points...) acted on the whole of the selection list.
This behavior has been standardized and all actions are now based on checked and visible lines.

Margin around territories when showing the global map

Maps now include a margin around the points of the territories, when zooming on all points, or when exporting the map, for a clearer display of the work area.

Spring '24 version

Publishing date: 14/05/2024

Main new features

New interface for automatic territory assignment settings

When you want to carry out automatic territory assignment, a new overview mode allows you to view the options at a glance. You can therefore launch the operation with a single click if the default options are suitable, for example.

New option for drawing territory outlines

This new option is available for countries having the possibility of carrying out studies on administrative entities.
It ensures that the drawing of the sectors follows the outline of the administrative units chosen in the configuration of the option.

Tool for updating analytical representations easily

In order to update the display of your analytical representations easily, a new tool lets you set progressive sizes for the icons, color gradients throughout the ranges, change the icon for all ranges in a single clic, etc.

Other improvements


  • Possibility to re-order ranges for analytical representations based on string values
  • Map layer showing roads closed during the 2024 olympic games (around Paris, France)
  • Possibility to define road exclusions (tolls, roads closed to hazardous materials transportation, etc.) in the user preferences
  • Auto-scroll when using drag-and-drop to move field order in the table of indicators
  • Data examples for more countries (Brazil, Mexico, Canada, Great Britain, Portugal, Spain, Denmark, Belgium, Switzerland, Italy, Thailand, New-Zealand), in addition to countries which already had example data (USA, Columbia, France, South Africa, India, Malaysia, Japan, Australia)
  • Support for full country names and ISO-3 country codes when importating data, in addition to ISO-2 codes


Back to summary  


Version Fall '23 - minor update of 5/12/2023

Import hundreds of thousands of points, work on geographic areas, export territory assignments on input points

When working on many points, it can be better to group them into areas and assign territories based on those areas.
For example, group points into postal zones and assign these postal zones to territories. The workload can be balanced according to the number of visits, or the turnover represented, or even the estimated average number of packages to be delivered, these values having been summed or averaged automatically during the import process.
/> When you then export your results, in this mode, the territory values are automatically dispatched to the original points.
You can thus work on very large volumes of points, or follomake the territory assignment follow geographical area borders (postal codes, municipalities, etc.) while working with data carried by points.
This new mode of study is useful for large volumes, but it can be activated regardless of the quantity of points you are working on.

Fall '23 version

Publishing date: 10/10/2023

Main new features

Customize the color theme of your studies

Adjust the brightness, saturation and transparency of your territories. You can highlight the territories with saturated colors, or sketch them with pastel colors, reveal the underlying map or, on the contrary, cover it completely.

Work collaboratively

Share a copy of a simulation with a colleague, let him/her improve it, then send it back to you in just a few clicks.

Create analytical (thematic) representations of your data on numeric fields

Already available on character strings, analytical representation by ranges is now possible on numeric attributes.
Two modes for automatic creation of ranges are available: equal intervals or variable ranges to have an identical number of items of each representation (balanced filling).
Additionally, it is now possible to create analytical representations on layers based on files (.xlsx, .ods, .csv)

Display your KPIs in the Comparison mode

When you compare two simulations, you will now find not only a comparison of the indicators for each sector, but also comparison charts for each of the KPIs that you have chosen to display for your simulations.

Other improvements


  • In layers, the number of points was limited to 1,500, it has been increased to 100,000
  • The maximum distance for isodistances using as the crow flies distances has been raised from 200 km to 1,000 km
  • The number of items covered by each range in thematics is now displayed in the interface
  • A new Area indicator is now available on polygon studies (and it now allows for density calculations in formulas)


Back to summary  


Summer '23 version

Publishing date: 22/06/2023

Main new features

Easily create regions of territories

Import sites with an attribute carrying a number of sub-territories to associate with it, and use this attribute for the creation of the territories associated with the sites.
This will give you sets of territories grouped by sites, forming regions around the sites.
You will also notice the new option in the map settings (layers) which allows to display the sub-territories with colors derived from that of the site when there are sub-territories.

New component for saving simulations/creating new ones

Now the default action is to create a new simulation. The renaming is done in the simulation manager. This behavior is more intuitive and will avoid renaming a simulation instead of creating a new one.

Other improvements


  • Territory and site attributes can be edited, sites can be deleted
  • Display point labels when geocoding, even when there are many imported points
  • New address field for indicating the State (eg: in the USA)
  • hh:mm:ss format for duration indicators in order to be able to display seconds


Back to summary  


Spring '23 version

Publishing date: 06/04/2023

Main new features

Live indicator value updates

No need to re-import your data to modify a few values: you can now change an attribute

  • with a value for a whole collection of objects
  • by directly editing values in the table


New geocoding interface

The interface has been revised: filtering on corrected addresses, grouping of identical addresses, use of address autocompletion for correction, better visibility of geocoded points in the map...
You were disconnected during your address correction? Take the same file, Territory Manager will suggest that you go back to where you left off with your corrections.
Some of your points already have lat/long coordinates, some don't? Territory Manager is now able to geocode only points not yet placed.

Thematics on districts, postal areas

Thematic analyzes are generalized to studies on surface entities: districts, postal areas, etc.
In addition, an automatic range creation function has been made available, for cases where the number of distinct values of the attribute is limited and allows automatic creation.
Suggested values are more convenient via displaying all values without starting to type the first letter, just by pressing the down arrow on the keyboard.

A new automatic territory assignment mode

Weighted territory assignment makes its appearance in Territory Manager:
Do you want to distribute the work for your team, but some people will only work half time, or 80%, and others full time?
No worries: Import their sectors with an attribute indicating their investable time, Territory Manager will assign them a charge that will be proportional to the time available.
The concept is also applicable to a balancing of parcel volumes that would take into account the capacity of delivery trucks.

Other improvements


  • Multiple selection of groups of objects in the table, via the Shift key.
  • Deleting points from the simulation via the interface
  • Filters in the table: new "among" and "is not among" operators. In addition, the filters are saved at simulation level and no longer at study level
  • The list of fields available for display shows all fields by default, but remains filterable by category
  • The home page takes less time to display than before
  • It is now possible not to display a base map at all, to better see the boundaries of districts or departments
  • The validity period of share links is now configurable (3 months maximum)


Real life workload

Available with the Operational load validation option of Territory Manager. Contact your sales representative for more information.
In order to balance territory assignments, algorithms are based on estimations. The load can subsequently be balanced, but estimations are sometimes optimistic, sometimes pessimistic.
A new Real routes tab has been added in the calculator, in which you can trigger the calculation of real life routes to perform all visits, day after day.
Those new fields provide precise indication of how many days are really necessary for performing all visits, of a territory, and consequently make sure that the workload given to teams is actually feasible.
Calculated routes are optimized, and if you want to follow these results in your daily routine, it is possible to use another tool from Nomadia: TourSolver, which will be adapted to provide daily route sheets.


Back to summary  


Publishing date : 4/01/2023

Minor update of January 4th 2023 :

  • Fix for Max distance and travel time KPIs sometimes stuck at 0
  • Added Distance and Travel time from site indicators on points
  • Always remember last country used when creating new studies
  • Maximum number of items in a study raised from 50,000 to 100,000

Publishing date: 18/10/2022

Main new features

New KPI panel

Show the achievement of your targets by highlighting the key indicators of the territory assignment:

  • Average number of visits per day
  • Maximum distance to travel
  • Maximum travel time for a territory
  • Ratio of actual working time (visiting) vs travel time
  • Weighted distribution (WD)
    ...

The KPIs displayed reflect the data from the territories indicated as visible in the table, for an analysis by territory, group of territories or for the whole study.
These KPIs can be exported in the PDF report.  

More space to work, better selection ergonomics

Menus have been reorganized to take up less space, and leave even more room for your study. Move mode in the map has become the default mouse mode, active when selection mode is inactive. The button to share the simulation with others in read-only mode has been brought forward into the main toolbar for more intuitive access.
The selection is now always synchronized between the board (selection checkmarks) and the map; the CTRL key allows you to add to the selection, and in Sectorization mode on polygons, it allows you to add entities to the study. The default selection filters on entities coming from the imported data (as they carry values of indicators).
Finally, it is now possible to move a point (or a group of points) in a study, if it had been badly geocoded, for example.

Thematics legend

Thematic analyzes now benefit from a legend, either in icons of fixed sizes (for thematics varying the symbology), or in icons of variable sizes (for those using only one icon, and varying in size according to an indicator). These legends have been made as compact as possible, so as to leave as much space as possible for the map display.

Comparison mode using transparency

The simulation comparison mode has been improved with the addition of a simulation overlay mode, and a slider to vary the transparency. This makes it possible to clearly identify the areas that change from one simulation to another by playing with the cursor. This mode is in addition to the side-by-side comparison.

Other improvements


  • Importing resources allows you to create new empty sectors
  • The PDF export has a new option to adjust the scale of the exported map, if you do not want to have the entire area studied, or if on the contrary you want a larger situation map
  • Ability to export durations in HH:MM format in Excel, rather than as a formattable number
  • Warning message as you approach the end of your subscription contract
  • Better preservation of names during automatic assignment on polygons, in particular use of site names for sector names
  • In multi-territory per site mode, it is now possible to run an automatic balancing on sites for an indicator, rather than balancing territories


Back to summary  


Version Summer 2022

Publishing date : 12/07/2022

A minor update occurred on July 12th 2022 :

  • Thematics are taken into account in exported maps
  • Setting values for thematic ranges now benefit from a filter on the indicator's available values
  • KML layer import can be canceled
  • Two new menus were added into the Actions menu of the table of indicators, allowing to invert the selection or the visibility of objects
     

Publishing date: 30/06/2022

Main new features

Grouping areas around sites

The grouping of geographical entities (postal areas, municipalities, etc.) according to balancing criteria or simply geographical connectivity was already possible in France, the United States and Canada. This coverage has been extended to India, but in addition, it is now possible to associate geographic entities with sites, as for point balancing. This paves the way for the use of new balancing criteria, such as the nearest grouping around the sites, or the fact that the workload related to the journeys is calculated from the sites and no longer from the barycentres of the territories.

Decorating the map with custom data in KML format

The maps provided in Territory Manager are already very complete: administrative boundaries, road network, aerial view, traffic, black & white version... However, it is sometimes necessary to visualize custom data, such as the territories currently assigned, the location of competitors, the theoretical limit of the territory to be distributed... Importing layers in KML (KML or KMZ files) addresses this need. These layers can be created either by exporting an existing territory assignment of TM (which is also new), or in another software, such as the Geoconcept GIS.

Displaying the points of the study with varying icons

When the points are divided into territories automatically, the software applies mathematical criteria and everything is fine. But when you want to observe things visually, for example to do touch-ups by hand, you may need to identify certain attribute characteristics via a particular visual rendering.
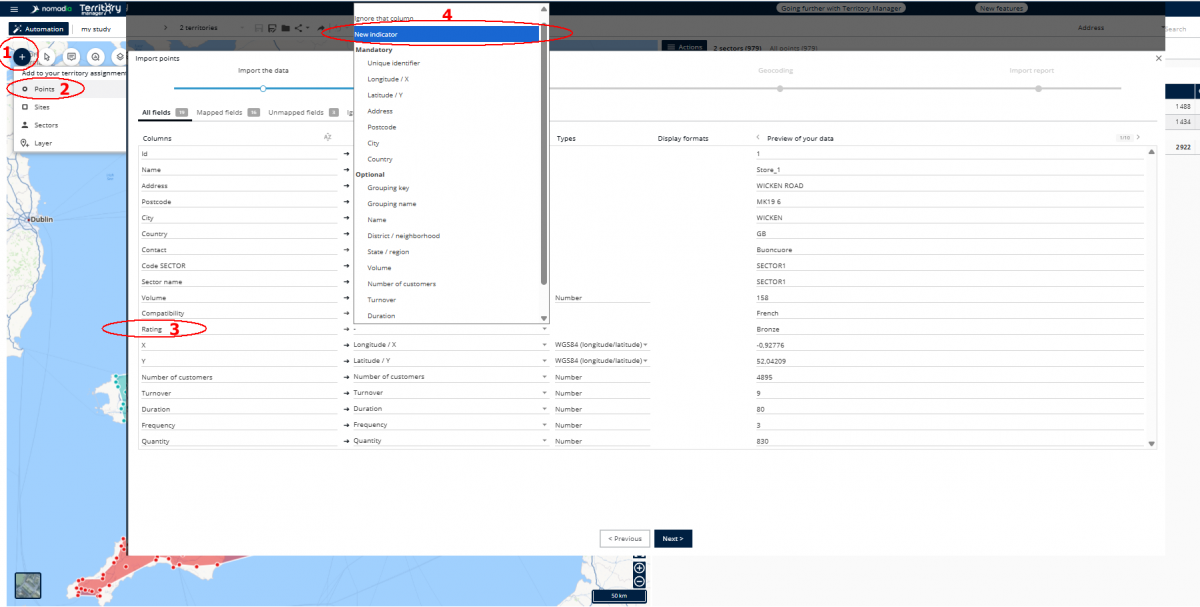
For this, a new analysis layer has been created: the Thematic layer. Applicable to a string type indicator, it is used to define display conditions based on the values assigned to the points, and to associate either an image (PNG file) or a colorable symbol (round, star, triangle, etc.) with them. You will thus be able to distinguish your GOLD customers from your SILVER or BRONZE customers, distinguish between several brands of shops, or differentiate the categories of warehouse or store surfaces through color or size gradients.

Stop losing your unsaved work

You may have already forgotten to save your work on Territory Manager and came back later than you thought, losing your work because your session had expired. Or even just having a power outage and seeing your PC shut down without being able to save. A feature for automatically saving work in progress has been implemented so that this does not happen again. When you reconnect to the site, Territory Manager will offer to save the contents of the last autosave found.

PDF reports

Once the territory assignment work is completed, it must be highlighted, presented within the company. You could already generate a link to the result of a study to present it in read-only mode in a web page to your collaborators (link icon in the list of simulations of a study). You could also export the data in the form of an Excel table to exploit them. You can now create a PDF file containing the map representing the territories created, the table with the indicators displayed in the Territory Manager interface, and even the chart chosen for display in the interface, for a clear and concise presentation of your results.

Back to summary  


Version Spring 2022

Publication date: 16/03/2022

New features

Management of several resources per site

Allows you to define a finer territory distribution by assigning different territories to the same reference site, useful, for example, when several resources organise their territories from the same agency or depot. The objective is twofold: to be able to assign an action perimeter to a defined resource (a salesperson, a deliverer, a technician, etc.) and to distribute the workload between the resources of the same site or of several sites.

Improved territory assignment around sites

The balancing algorithm on site has been optimised: even if the sites are very close to each other, or overlapping, outside the zone the engine proposes balanced territories.

Field grouping management

Because it is sometimes necessary to link, at the time of an automatic balancing, the points having a common characteristic, Territory Manager authorizes this action to, for example, allocate all the customers who have the same postal code or the same address to the same territory, to allocate a list of specific customers to a technician, to allocate all the prospects to a salesperson in particular...

Balancing on a selection of objects

When setting up an automatic balancing, the user can now choose the points he wants to balance and not all the objects imported into the study. The user can also decide to exclude unassigned points from the process.

Adding points, sites and resources to an existing study

It is now possible to import new objects into an existing study, directly from the map and benefit from the territories already balanced.

Display of isochrones/isodistances

The isochrones/isodistances represent the areas accessible in a defined time / distance around a point (a shop, a branch, a depot...). Taking into account traffic speeds and specific road accessibility, they allow to visualise the operational coverage of a site (or a territory - taking as reference point the barycentre of the sector) and to easily distinguish the points which are not covered. Isochronous/isodistanced areas can be calculated with or without overlap.

Moving a site

The user can easily move a site from the map and see the changes in all the indicators in the table (turnover, sales potential, workload, etc.). This feature also allows the user to define new realistic targets adapted to a new organization and is also used for locationing studies when one or more new sites are to be selected, or, for example, to analyse the impact of a move.

Workload snapshot

The software can calculate the workload associated with each territory and compare it to the variations generated by automatic balancing.

Easy search of studies and simulations

A search engine and a filter make it easy to find a specific study based on criteria or keywords.

Addition of vehicle profiles

Two new profiles (pedestrian, truck) have been added to the car profile. In addition, the user can now select the speed profile (fluid, medium, moderate, dense, congested) best suited for the area of study and/or the period for which the balancing is performed.

Road network enhancement

Thanks to the new layer selector, the user can highlight the road network in the map in order to better understand the organisation of the territories.

Ergonomics

Richer and more straightforward interface

The action button at the top of the table groups together the features for operating on the territories. The most common actions are also available in the upper toolbar. The selection of objects in a territory is facilitated by a simple click in the table. For more intuitiveness, some elements have been moved/grouped in the buttons on the map (layer selector, adding points, sites or resources, label positioning, map setting, ...)

Customizable infobox

The user can configure the information that is displayed on mouse-over in the map.

Several labels

A few clicks are enough to add one or more labels to territories, layers and sites in the map.

Help guides

In order to facilitate the use of the solution, guides are available to introduce the new features and explain some of them with concrete illustrations.

Redesign of the home page

The home page of the solution has been modernized to display more studies previously carried out by the user.

History of undone/redone items

The user has access to the history of actions in the Undo/Redo menu and thus can return directly to the step of his/her choice.

Territory assignment Wizard

The territory assignment wizard has been enriched and its ergonomics have been redesigned for greater simplicity.

Progressive display

The progressive display, to visualize the impact of manual changes or those made by an automatic balancing, is decoupled: it can be displayed independently in the map (via the Analyze button) and/or in the table (via Modify the displayed indicators).

Not only, but also…

Customized polygons

It is possible to integrate other geographical entities that meet other needs than those provided as standard (Postal codes, ...). For this, please contact us.

Improvement of the display of territory boundaries on polygons.

Automatically assign points to the nearest site.

Automatically assign features to the territory whose envelope covers them.

Adding points of interest in the address search.

Back to summary  


Version Summer 2021

Publication date: 19/05/2021

New features

Progressive mode

Progressive mode has been added so users can make changes and see the impact these changes have as they go along. This means they can evaluate the precise impact modifications made either manually or via an automated territory breakdown will have. In this mode, beside each value in the table will appear percentages of variation engendered by the modifications made, and secondly, in the map display the user can see the points that have changed territory: the colour fill for the interior of territories is that of the new territory, while the outline colour corresponds to that of the former territory to which the territory was assigned. This display remains active until the next time the session is saved, and so allows the user to study the impact of various modifications step-by-step.

Progressive mode is enabled by default. It can be disabled from the My Preferences window.

Calculation of custom indicators

The Summer 2021 version allows the user to create their own indicators:

  • « Nearest », defines, for each of the points, a new indicator based on proximity (using fastest, shortest, or as the crow flies calculations) to either the sites, or the additional layers imported into the solution.

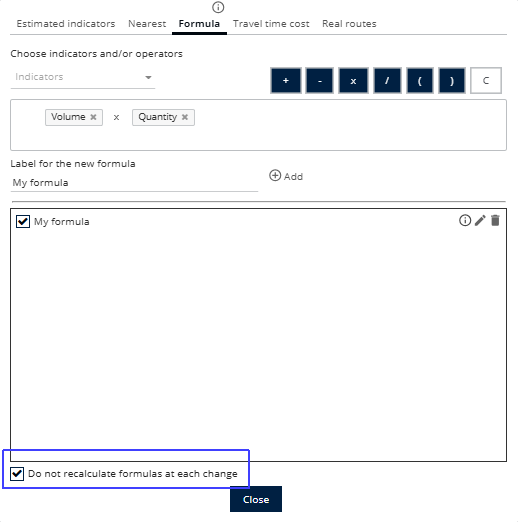
  • "Formula", authorises the creation of a new indicator by combining pre-existing indicators with indicators sourced by previous calculations using the different operators available (add, subtract, multiply…).

Business specific terminology

From the My Preferences window, you can now customise the terminology used so your preferred vocabulary is used in the interface. In addition to terms displayed by default (point, site, territory) terms specific to business activity (customer, agency or branch office, territory) and technical terms (such as intervention, agency or branch office, sector) have now been added.

Facilitating uptake when first using the application

Territory Breakdown Assistant

To help in the configuration phase for automated territory breakdown, Territory Manager now offers an illustrated and simplified assistant that provides guided support in a few simple steps. Advanced functionalities that are not shown in the assistant remain accessible to more experienced users.

The Territory Breakdown assistant is enabled by default. It can be disabled from the My Preferences window.

Introductory guide

Guided help is now embedded in the solution, consisting of animated tutorials that guide the user step-by-step in the application to accomplish various tasks, this guided help is as useful to the novice as it is for all users needing to pick up information about new features every time a new version of the software is released.

Trial version

A trialling and evaluation version is currently available so users can explore the utility of the solution while trialling and testing Territory Manager for 30 days. They will have access to all functionalities, with the exception of export and the sharing of territory breakdown results. Trialling users can import up to 2,000 records of their own data.

Cartographic representation

Adding labels

You can now add labels to additional layers, as well as to territories resulting from a territory breakdown on a polygon.

Enriched analyses 

Display functionalities on barycenters and flows are available with territory assignment on a polygon.

Black and white map background

In black and white, a discreet map background provides the ideal backdrop for highlighting a particular set of business data to enhance your presentations and analyses.

Dynamic sizing of points

A new degree of granularity: dynamic, allows you to display points with an intermediate size between fixed and fine modes. For Dynamic large and Dynamic fine, the display of points on the map will vary as a function of the zoom level.

The display mode for points can be configured in the My Preferences window.

Ergonomics

Table

Many changes have been applied to streamline and improve workability:

  • The name of territories can now be edited directly from the table
  • Customization of the totals line from the table
  • Improved editing of column width
  • Configuration of the colour of territories and display of territory tabs are accessible now from the menu displayed to the right of each line.

Keyboard shortcuts

To make some tasks easier to execute, we have added a series of keyboard shortcuts to, for example, save a simulation, export results, or again switch from selection mode to move in the map mode. The full list of keyboard shortcuts is available in the documentation.

Menu

In the menu, two new entries allow the user to:

  • Display the full list of studies to access those chosen directly without having to go via the Home Page.
  • Access the descriptive file of the current simulation

Toolbar

Two new shortcuts to Save a copy and Share have been added to the toolbar for rapid access to these functions.

Moveable windows

For easier working, all windows associated with the map action buttons can now be moved, a cursor indicates the displacement area. Closing these windows is possible either by clicking on the cross at the top right of the window, or by clicking anywhere in the solution.

Filters and Searches

Filter – Edit

The user can now edit the value of an existing filter.

Selection using a filter

When using a filter to make a selection, the points included are now easily identified in the map.

Search on additional layers

The Search function, available at the top right of the interface, has been enriched in order to authorise the search on points imported into the solution by the user.

Enhanced performances

Accelerated automated territory breakdown

When performing an automated territory assignment, the calculation matrix is saved in a cache, and so no longer needs to be generated each time a new request is made, resulting in tangibly better performances and savings on calculation times.

Fluidity of displays

The use of a new technology allows simultaneous display of several tens of thousands of points on the map without any loss of performances in terms of display speed, or speed of selection and modification of points.

But also…

Sharing

  • Addition of a legend for territory displays in exported maps

  • For easy reading of the map, addition of alternate colour coding in the Excel file ouput resulting from the comparison of simulations.

  • Various improvements in sharing from a territory assignment on polygons.

Automation

  • Partial territory breakdown is also available for Sites. This allows the user to choose the territories on which an optimization will be performed, and so to protect any territories that are to remain unchanged, hiding them using the .

Back to summary  


Version Winter 2021

Publication date: 08/12/2020

Simulation and analysis

Comparing simulations

This new tool is especially useful to evaluate, for example, changes made to a current territory assignment when creating a new scenario.

Comparing simulations allows you to see, on the one hand, precise differences on the map, with points that have changed territories highlighted in the display, and on the other, to assess the impact of the changes on indicators in the table, where the percentages of variation are automatically calculated. Finally, export of a summary table in Excel format provides detailed results of the comparison, to identify and quantify the gains and losses for each territory individually as well as globally for the two maps being compared.

New display options

Data representation in the form of dynamic gauges in the table and in the map has been enriched. In addition to the existing representation permitting evaluation at a glance of the value of indicators for each territory in relation to the mean for all of the territories, it is now possible to display values as a function of the standard deviation and/or attainment of a custom threshold, and to represent this on the map.

Filtering on date and duration

You will now be able to take indicators of the date and duration type into account with a view to applying selection and sort filters on these fields (for example, Which clients require a visit duration of more than 12 minutes? Or, Which clients have not been visited for 60 days or more, or since 11 November 2019?).

Territory assignment optimization

Drag-and-drop

To facilitate manual modifications, the transfer of points from one territory to another can now be applied directly in the map with a simple drag-and-drop.

Target value

Where before the user might simply distribute and balance points within a defined number of territories, this new territory assignment method allows you to request Territory manager to calculate the number of territories needed to attain a target value, such as, for example, an average potential of one million euros for each territory.

Partial territory assignment

The partial territory assignment allows you to choose the territories to which the optimization will be applied, and in doing so, to protect those that the user wants to leave unchanged.

Visit frequency

To assess the workload with greater precision, the visit time (or any other suitable indicator) can now be multiplied by the visit frequency that is associated to the point.

Geographic Unit Analysis (UGA)

The 746-block UGA (Geographic Unit Analysis) map is a breakdown of France used by the pharmaceutical industry. This breakdown is integrated in the solution for territory assignment on polygons.

Sharing

Interface

The sharing function has been moved into the new menu on the Territory assignment page.

Map

A new method for sharing has been added enabling export of territory assignment maps in .jpeg format, with a choice of parameters for the resolution, image and territory size. A separate file for each selected territory can also be generated.

Geometry

Geometry mode authorises export of geometries for envelopes for each territory of a simulation in .GeoJSON format, a format that can then be integrated in other tools, such as a GIS.

Ergonomics and taking control of the solution

New menu

A new menu has been added in the Territory assignment page grouping together the access commands, and commands for comparison, saving and sharing.

Save

The behaviour of the Save function has been revised so as to authorise a rapid save operation throughout the creation of the current analysis.

Attribution of territories

Attributing new territories created following an automated territory assignment is facilitated via an interface that suggests the names of previous territories.

Cancel and restore

The functionalities enabling you to cancel or restore the last action applied are now useable after an automated territory assignment in addition to manual modifications.

Select all / Partial selection

A new Select all button allows selection of all the points on the map. A second button, Partial selection, allows you to select only the points occurring on a series of chosen territories.

Territory assignment on sites

It is now possible from a site territory assignment to run an automated point territory assignment, and then to go back to a site territory assignment within a single analysis.

Improvements on sites

  • A new button in the table allows you to zoom-in directly on the list.
  • Sites can be hidden/displayed from the configuration window
  • The site for a territory is automatically highlighted when you move the mouse cursor over the territory or select it.

Geocoding

In order to assess the quality of geocoded addresses more quickly, a colour code, on the map and in the table, allows you to identify the addresses on which it would be desirable to apply a manual treatment (a repositioning, for example).

Dynamic display of points

The representation of points on the map varies as a function of the zoom level: the further into the map the user zooms, the larger the points show on the map. It remains possible to use the previous display mode from the My settings menu.

My settings

This menu has been added to the interface so as to enable the user to customize display preferences (language, measurement units, representation of points, …).

Information

The history of information shared by GEOCONCEPT within the application (version releases, new features, maintenance messages…) are now saved in the interface and so can be consulted at any time.

Main tabs

For greater clarity in the interface, main menus are only displayed when an action in the tab is possible.

Back to summary  


Version Summer 2020

Publication date: 09/06/2020

Principal innovations

Adding different information and analysis layers

  • Custom layers

Users can now choose to display additional layers in the map, to show: competitors, partner network, prospects...

These layers are easily imported and customised via a layer manager.

  • Flows

Representation in the form of flows (or spider maps) linking all the points within a single territory, notably enables highlighting of individual, isolated points.

  • Barycenter

It is now possible to calculate the barycenter, that is, the center of gravity on territories, as a function of a field (potential turnover, visit duration...) which is in turn affiliated to the road network. The center of gravity is useful, for example, if you want to study the siting of a branch office or outlet, or identify the ideal location to recruit a sales rep or other staff member, so they will be able to provide optimum coverage of a particular territory, operating in proximity.

  • Administrative boundaries

Representing administrative boundaries of regions and/or departments (available now for France – coming soon for other countries).

  • Hiding points in a territory

This is invaluable when you need to display only selected entities, such as boundaries, or associated geographic entities.

  • Label

Customise the label to display on territories (name or any other value: number of points, potential, name of the manager or person in charge) and define its appearance.

Modular interface

Users can customize their working interface within the solution, for example, by pinning the map on its own to a second screen, for ease of working. Each panel (map, table, graph) in the page can be hidden, enlarged, re-sized and above all, detached to ensure total modularity and authorise in this way working on several screens.


To activate the function, click on the screen-shaped icon at the top right, and then move the various elements to edit the page layout as required.

Filtering on fields

Addition of a filter to perform multi-criterion searches in your tables. From the filter bar, the user defines their search criteria and can save all of their filters so they can be reused later.

Taking an existing territory assignment into account

New algorithm that allows you to specify the degree of modification to apply to an existing simulation with the automated territory assignment engine. This option notably allows you to define whether a simulation must be entirely re-optimized, or whether only part of the result is to be retained.

Sharing the results

Because sharing the results of a territory assignment is crucial for the analysis of different scenarios and decision-taking, new export options are now available, as follows:

  • Exporting values from input columns

Whether these are used or not in territory assignment calculations, all imported fields can be exported into the results, in all tabs.

  • Adding dynamic totals

Restitution tables have a line that automatically calculates the total of all values contained in each of the columns. These totals are dynamic, and facilitate application of other calculation operators.

  • Creating one file per territory

This is especially useful to easily share the right information with the right person.

Ergonomics

User feedback has provided pointers for improving several aspects of the solution’s ergonomics to boost working efficiency.

Home page

  • The Home page has been simplified so you can simultaneously display links to your three latest studies

  • Information messages published in the form of notifications in the home page inform you about:

    • The solution status (new version, new functionalities)
    • Infrastructure maintenance operations

Repeating an action

In addition to an undo function to cancel previous actions, a redo function now enables you to restore actions made. Useful for correcting manipulations made in error, for example…

Map panel

  • Simpler interface, with the Analysis and Edition tabs removed: the contents of these have been moved into dedicated pages

  • New buttons arrangement:

    • Display the study zone => bottom right of the map
    • Density => in the Analysis button
    • Edit indicators => top right of the table
    • Automation => relocated in the lower toolbar

Table panel

  • Enable action buttons relating to each item when you move the mouse cursor over the line concerned

  • Adapt the width of each column in the table

  • New, simpler, design of transfer buttons

  • Conversion of indicators calculated in minutes

When Territory Manager performs load calculations (based on the journey time) from time data, it converts them automatically and displays them in a Hour:Minute format for easier interpretation of the results.

Not only, but also…

Indicator

  • Rename at any moment the indicators displayed in the map and in the table, via the indicator properties.

Search

  • The search engine is available at the top right of the interface, and has been enriched to allow search for a point, a site, or a territory by its identifier in addition to its name.

Automation

  • The territory assignment algorithm has been improved to guarantee better management of superposed points (for example, several contacts located in the same physical building).

Back to summary  


Publication date: 29/11/2019

Main new features

Barycenter

Display the center of gravity for each territory by displaying its barycenter.

Show the Site location within its territory boundary

The user can now choose to display, or not, the site within the territory boundary.

Labels for studies and simulations

Available at all times at the top of the Territory assignment page, these labels can be renamed when you click on them.

Selection

A new «by click» selection mode facilitates interaction when selecting points or polygons.

Ergonomics

The solution has been redesigned to take into account suggestions and feedback from end users so it is even more fluid and intuitive. The many improvements made as a result make the interface much simpler to use overall.

  • Analysis and Edition tabs

Distribution of functionalities within the two tabs: for the Analysis tab this relates to the display elements, and for the Edition tab, all interactive functions used to edit territories.

  • Map window

The map window has been revisited and now includes buttons so you can interact directly with it.

  • Selection tab

This new tab opens whenever a selection is active. It allows transfers to one or several target territories.

  • Hide/display territories

Using the eye in the Territories tab allows you to display or hide a series of territories simultaneously in the map and in the graph.

  • Full screen display

The map and table windows can display in full, or reduced screen modes.

  • Estimation indicator

Accessible from the Analysis tab, this button allows you to add additional indicators to the table in order to simulate the duration and/or distance of an optimized route for each territory.

And also...

Performance

  • The home page now features faster loading of saved studies

Configuration of indicators

  • The window for configuring indicators has been simplified, and now features the option to edit the display order for indicators using drag-and-drop. Finally, it is now possible to have different configurations for territories and points/polygons.

Table tab

  • The magnifier at the top of the active tab performs zoom-in and zoom-out on points in a territory, in a selection, or on unassigned points.

Back to summary  


Publication date: 26/07/2019

Main new features

Analysis and Ergonomics

  • Dynamic graphs

Dynamic graph displays on the various indicators makes decision-making even easier by adding a new intelligent visual dimension to your data. Fully customisable with choice of display modes and indicators, you can also choose to focus on a reduced number of territories by using filters.

  • Representation of territories

Map legibility is enhanced using colour ranges in distinct tones for contiguous territories.

  • Search tool

This tool uses an intuitive autocomplete mechanism to search for, and display, a customer, an address or a city in the map and the table by names or allocated code.

Automation

  • Improved workload calculation

Associated to dynamic graphs you now have balancing based on workload, combining estimated journey and visit times, providing additional attributes facilitating instant viewing of territories differences and deviations.

  • Automated balancing on polygons

In addition to interactive mode, it is now possible to create balanced territory assignment on polygons automatically, whether on IRIS entities or towns and cities.

  • Assignment to the nearest / Isochrones

The assignment function bases calculations on the geographic proximity between sites and points to generate territories using new constraints, including for example, a different maximum capacity not to exceed for each site. Without constraints, the territories created correspond to isochrones without any cannibalisation.

  • Route estimation

Before or after a simulation, this function determines, for each territory, the time and distance needed to complete an optimum route linking up the various points or route stops to visit.

  • Improved balancing on sites

Balancing on a site returns – depending on the cursor positions – a very varied result amplitude, on a compactness-to-balancing range.

  • Territory assignment as the crow flies

The ‘as the crow flies’ calculation method can be useful to rapidly obtain a preview prior to a full simulation.

Interactive editing

  • Deleting a territory

If a territory is no longer needed, the user can delete it.

  • Merging territories

The merge territories function groups several territories into just one, deleting or not as appropriate the original territories.

And also...

Documentation

  • Help popups on the screen in the automated territory assignment window explain the different options available.

Enhancements

  • Implementation of the function to assign points to nearest territories for unassigned points.
  • Dynamic display of heat maps linked to the current map scale
  • After a geocoding operation, display of qualitative graphs
  • StreetView display when geocoding to validate the positioning of an address
  • Option to hide/display the IDs and names of territories in the indicators table.

Back to summary  


Publication date: 15/03/2019

Main new features

Performance

  • Improved calculation performance

New coding and powerful algorithms make the new version of Territory Manager four times faster, and you can now perform territory assignment at continental scale.

  • Tables now display large numbers of lines in tables

Optimization of the display to show several thousand lines in browsers.

Studies and simulations

The various simulations grouped in studies can now be saved and consulted from within the solution. From the Home page, the user can choose to open an existing study or create a new one.

Simulations can be shared with other team members, who will have access to the map and all the information it contains. They will nonetheless not be able to edit or change simulations.

Automation

  • Calculation of travel cost

A new algorithm has been added to balance, not only on visit duration, but also on an estimation of travel time/distance in order to determine the optimum work load by territory.

  • Retention of territory names

When a new territory assignment is performed, if for a given territory, the majority of points were present in the same initial territory, the name of the old territory is retained. In the opposite scenario, territories are numbered in sequence.

  • Enhanced territory assignment on points

In addition to the number of points, the solution proposes to combine up to three different indicators (for example, revenue, potential, priority…) to calculate a balanced territory.

  • Improved territory assignment around a site

Automated territory assignment around a site authorises the utilisation, as an option, of the number of points or of an indicator for the purpose of balancing.

Edit functionality

  • Redistribution of points on the nearest territories

To simulate the closure of an agency or site, this new functionality redistributes a territory and its points to territories nearby.

  • Selection in the table

The user can select objects from the table to apply transfer operations to another territory, and to cancel the assignment in order to create a new territory with the selection.

  • Transfer window

Enrichment of the summary table with the addition of values and dynamic sums for each indicator chosen.

And also...

Share

  • Exporting a map (Excel or Google Drive)

Addition of a map and its legend in the file, and also, as an option, territory labels and points.

  • Retention of original columns

There is now an option to conserve the original "grouping key" and "grouping name" columns to facilitate comparison of modifications.

  • Numeric sort

Improved sorting on numeric fields.

Edit functionality

  • Circle radius distance

Display of the distance when selecting with a circle.

  • Cancel the selection

Empty the current selection.

Analysis

Analysis now includes a representation of density (heat map) on all indicators.

Import

Additional warnings have been added in the event of inconsistent data.

Geocoding: address handling is no longer limited to 500 addresses. From this release onwards, all addresses will be included.

Geocoding: the Statistics window opens on completion of the treatment.

In the absence of grouping information, the territory assignment opens on the «NOT ASSIGNED » tab.

Ergonomics

Utilisation of icons in the "header".

Addition of a selector so you can choose the map background from a series of possible backgrounds (map, satellite, traffic, transport networks, etc).

Enhancement of different styles (points in the map, forms…)

Territories are no longer highlighted when a point is selected.

The infobox form is now disabled by default.

The Transfer window can now be moved to enable map consultation during manipulations.

Territory assignment API

Provision of a full territory assignment API that facilitates access to all the solution’s functionalities (algorithms, interfaces…) that can be integrated in other application solutions.