| Shortcut | Action | Corresponding icon or button |
|---|---|---|
|
Space bar |
Switch from selection to browsing mode |
|
|
CTRL A |
Select all |
|
|
CTRL D |
Deselect all, empties the selection |
|
|
CTRL Z |
Undo the last modification |
|
|
CTRL Y |
Restore the last modification |
|
|
CTRL Space Bar |
Run the automatic territory assignment wizard |
|
|
CTRL O |
Open the list of saved simulations |
|
|
CTRL X |
Export |
|
|
CTRL I |
Information on the map |
|
|
CTRL ALT N |
Create a new territory from the selection |
|
|
CTRL ALT U |
Cancel the assignment |
|
|
CTRL S |
Save the simulation |
|
|
CTRL ALT S |
Save a copy of the simulation |
|
|
CTRL K |
Compare two simulations |
In the list of simulations |


| Shortcut | Action | Corresponding icon or button |
|---|---|---|
|
Ctrl+M |
Merge selected territories |
|
|
Ctrl+Alt+D |
Distribute all unassigned points to the nearest territories. |
|
|
Ctrl+Alt+I |
Allocate selection to territories. |
|
|
Ctrl+Alt+R |
Reverse territories selection. |
|
|
Ctrl+Alt+V |
Reverse territory visibility. |
|


Progressive mode must be activated. It is enabled by default. You can check this by clicking on the Edit displayed indicators icon  . Progressive mode can be enabled bottom left of the display.
Progressive mode must be activated. It is enabled by default. You can check this by clicking on the Edit displayed indicators icon . Progressive mode can be enabled bottom left of the display.
When a point assignment is changed, progressive mode highlights the point that has changed territory on the map (if it is displayed via the map icon Analyse) and the impact on the balancing indicators.
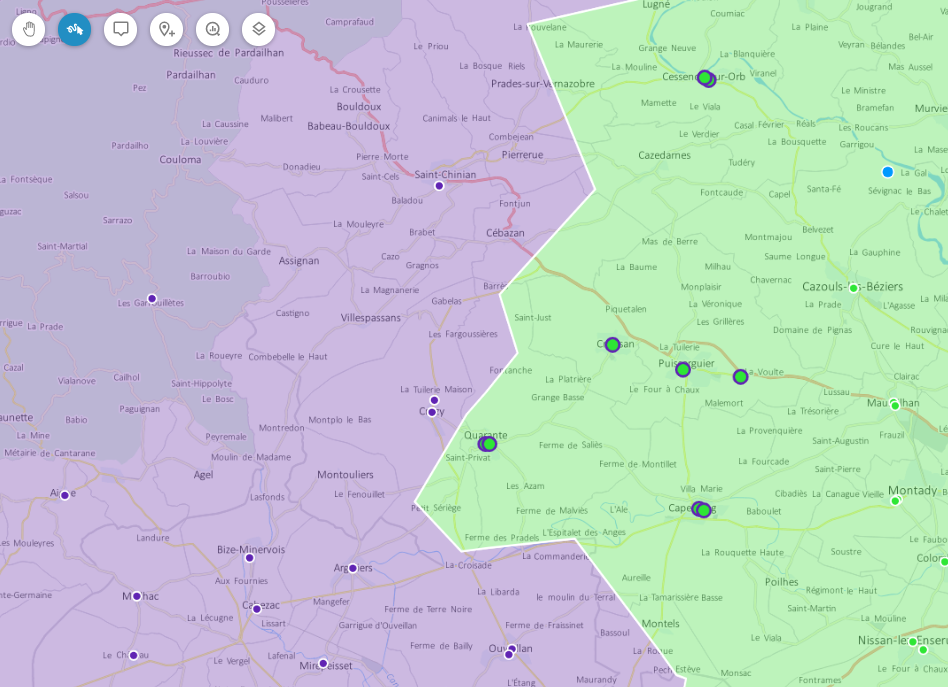
The points transfered on the map display the colour of their new territory (point colour fill) and the colour of the previous territory of assignment (point contour).
The balancing indicators indicate the percentages of modifications linked to these transfers.
When the percentages of variation are positive, they display in green; when they are negative, they display in red.
This display remains enabled until the analysis is next saved, so that the user can decide whether to keep or discard modifications.
![[Note]](images/community/docbook/note.png) |
Note |
|---|---|
|
The default display includes the map and table panes. |
-
In the toolbar, click on the Edit pane display icon
-
Drag-and-drop the icon for the pane to be displayed to the chosen zone
Add map pane

Add table pane

Add graph pane

Add key indicators pane (KPI)

-
In the toolbar, click on the Edit pane display icon
-
Above the selected pane, click on Expand pane

-
In the toolbar, click on the Edit pane display icon
-
Above the selected pane, click on the Open in new window icon

-
In the toolbar, click on the Edit pane display icon
-
Above the selected pane, click on the Hide pane icon

- To display the new pane, hover with the mouse over the pane and click inside it
- Position the cursor at the boundary between the panes.
- Drag with the cursor to the desired pane size.
-
In the toolbar, click on the Edit pane display icon
- Click and hold on the greyed out zone above the selected pane
- Drag-and-drop the pane onto the pane to be switched to
-
In the toolbar, click on the Edit pane display icon
-
Above the selected pane, click on the Collapse pane icon

-
In the toolbar, click on the Edit pane display icon
-
Click on the Cancel change of page layout icon


-
In the toolbar, on the right-hand side, click on the drop-down menu for filterable map elements
-
Select an element
Filterable elements Search description Postal address
All or part of the address
Points
With ID or name
Territories
Sites
Custom layers (if available)
A point on the additional layer, with ID or name
Recent searches (if available)
Choose a previous search
-
Click on the Map information map icon

- Cick on the Information in the map button to move its cursor to the right
- Click on the selected element in the drop-down menu
| Element | Display when mouse hovers over item |
|---|---|
|
All |
Information about sites, points, polygons, territories and additional layers |
|
Sites |
Site information only |
|
Points/polygons |
Point/polygon information only |
|
Territories |
Territory information only |
|
Layer |
Custom layer information only |
- Hover with mouse on chosen object or site
-
Click on the Map information map icon
- Click on the Site label or Territory label button to move its cursor to the right
- Click on the chosen information in the drop-down menu
- If required, click on the Add label button to add an information item to display
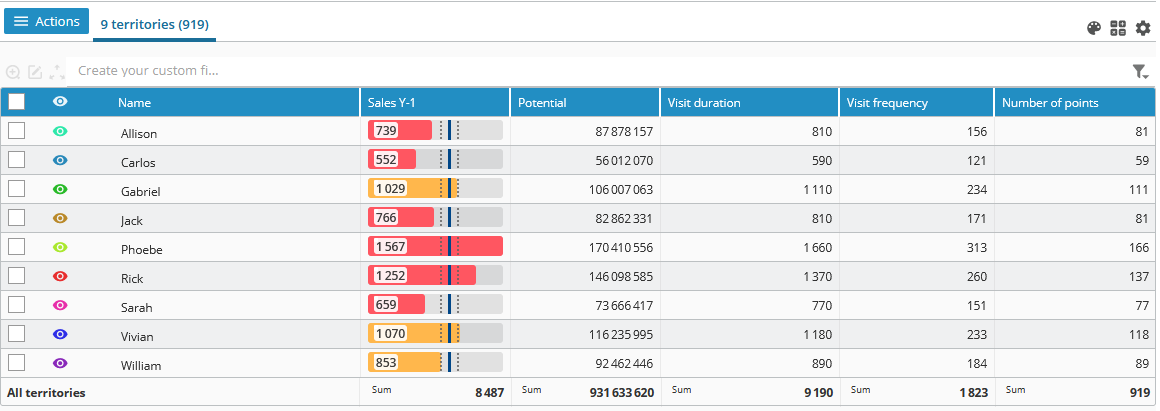
In this example, the Potential indicator has a display setting positioned on Balancing.
The mean for the indicator is shown as a solid navy blue vertical line on the colour gauge.
Dotted vertical lines on either side of this indicator signify a differential of 10% in relation to the mean.
| Colour | Deviation from the indicator mean |
|---|---|
|
|
More than 15% |
|
|
Between 10 and 15% |
|
|
Less than 10% |


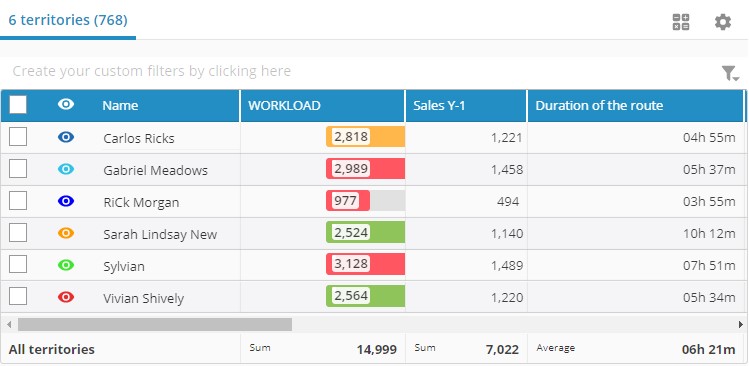
Below each indicator column is a total aggregator (Sum, by default) that can be edited as required.
This will also work for adding a pre-defined field.
-
Above the table pane, click on the Edit displayed indicators icon
- Click on the territory tab, or the Points tab depending on the chosen indicator
-
Under the tab, click on the drop-down menu to choose the indicator type according to the indicator chosen
Indicator type Description Pre-defined fields
Groups identification fields (ID and name) for geographic points/entities and territories.
Imported indicators
Data qualified by balancing indicators at the time of the field association.
Calculated indicators
- Number of points,
- Number of resources,
- Territory compactness (%),
- Density (points per km²),
- Area (km²)
- Distance from sites to points (mean in kms)
The last indicator is only available on a territory assignment around sites.Estimated indicators
Route distance (in kilometers)/route duration (in hours : minutes : seconds).
When the territory assignment concerns sites:
- Route distance/duration when departing from the site,
- Route distance/duration when returning to the site,
- Route distance/duration when departing and returning from/to the site. - Click on the chosen indicator in the list on the left
-
Click on the Add selected indicators icon

- Click on the button
-
Above the table pane, click on the Edit displayed indicators icon
- In the list on the right, in the line of the chosen indicator, click and hold
- Move the indicator to your preferred position
- Click on the button
-
Above the table pane, click on the Edit displayed indicators icon
- In the list on the right, click on the drop-down menu corresponding to the representation of the chosen indicator
-
Click on the chosen display
Display Description Value
Display the numeric value for the territory.
Balancing
Displays a guage, the colour of which reflects the percentage deviation from the mean.
Deviation from the mean
Displays standard deviations that are positive and negative in relation to the mean.
Custom threshold
Uses the same colours as for balancing, but it is the user who defines thresholds in the table to pass from one colour to another.
- Click on the button
From the table, the All objects tab or the Selection tab,
- Click on the indicator value to be modified
- Enter desired value
- Click in the table
- Click on Validate.
Indicator values of several objects can be updated:
-
By an absolute value,
- By a value corresponding to an indicator filling rule based on the classes of a thematic layer.
From the table, the All objects tab or the Selection tab,
- v
- Click on Actions
- Click on Update indicator
- Select the indicator to be updated from the Indicator list
Update from an absolute value
- Enter desired value
- Click on Validate.
Update from a rule
The rule is based on the classes of one or more thematic layers composed of value intervals.
- Choose the desired rule from the list Value or rule
- Click on Validate.
Create an indicator filling rule
The rule is based on the classes of one or more thematic layers composed of value intervals. At least one thematic layer must exist.
From the table, the All objects tab or the Selection tab,
-
Click on an object’s checkbox to select it
This is necessary to access the functionality - Click on Actions
- Click on Update indicator
- Choose an indicator from the Indicator list
-
Click on the icon
- Click on Available rules
- Enter a name for the rule to be created
- Choose the thematic layer from the Column classes list
- Select a second thematic layer from the Column classes list, if necessary
- Enter fill values
-
Click on the disc icon

- Click on Close
Modify an indicator filling rule
From the table, the All objects tab or the Selection tab,
-
Click on an object’s checkbox to select it
This is necessary to access the functionality - Click on Actions
- Click on Update indicator
- Choose an indicator from the Indicator list
- Choose the rule to be modified from the list Values or rule
-
Click on the icon
- Modify rule
-
Click on the disc icon
- Click on Close
Delete an indicator filling rule
From the table, the All objects tab or the Selection tab,
-
Click on an object’s checkbox to select it
This is necessary to access the functionality - Click on Actions
- Click on Update indicator
- Choose an indicator from the Indicator list
- Choose the rule to be modified from the list Values or rule
-
Click on the icon
-
Opposite the chosen filter, click on the trash can icon

- Click on Yes, delete rule
- Click on Close
-
Above the table pane, click on the Edit displayed indicators icon
- n the list on the right, click on the Gear icon corresponding to the chosen indicator
- Click on the Total drop-down menu corresponding to Line
-
Click on the type of value required
Note The types of value available are:
- Sum
- Mean
- Minimum
- Maximum
- Count
- None
- Click on the button
- Click on the button once again
-
Above the table pane, click on the Edit displayed indicators icon
- n the list on the right, click on the Gear icon corresponding to the chosen indicator
- Click in the Indicator field
- Enter the new name for the indicator
- Click on the button
- Click on the button once again
The indicator format can include, or not, figures after the comma (up to 4 figures).
If the indicator is a duration, it can be in hour, minute (xhxm), hours, minutes, seconds (xhxmxs) or day, hour, minute (xdxhxm) format
-
Above the table pane, click on the Edit displayed indicators icon
- n the list on the right, click on the Gear icon corresponding to the chosen indicator
- Click on the Format drop-down menu corresponding to Line
- Click on your chosen format
- Click on the button
- Click on the button
The total aggregator is located at the bottom of the column for each indicator in the table pane.
|
Note |
|---|---|
|
Available aggregators are:
|
- At the bottom of the table, click on the total aggregator for the chosen indicator
- Click on your chosen total aggregator
The aggregator format can include, or not, figures after the comma (up to 4 figures).
If the indicator is a duration, it can be in the hour, minute (xhxm) format, or the day, hour, minute format (xdxhxm)
-
Above the table pane, click on the Edit displayed indicators icon
- n the list on the right, click on the Gear icon corresponding to the chosen indicator
- Click on the Format drop-down menu corresponding to Column
- Click on your chosen format
- Click on the button
- Click on the button
You can filter territories and objects (geographic points and entities) that fulfil selected criteria in the table. A filter comprising several components can be created.
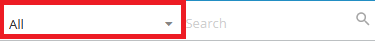
- Above the table column headers, click on the filter creation zone
- Click on the header of the column to filter
- Click on the chosen operator
- Enter the filter criterion
- Press Enter key at the keyboard
Available operators:
| Data format | Available operators |
|---|---|
|
Text |
- among |
|
Number / Duration |
- = |
- Above the table column headers, click on the Create formula icon for the chosen search filter
- Edit the formula criterion
- Press Enter on the keyboard
-
Above the table column headers, on the right, click on the Load saved filters icon

- Under the heading Save current filter, enter the filter name
-
Click on the disc icon
-
Above the table column headers, on the right, click on the Load saved filters icon
- Click on the name of the chosen filter
Using graphs affords enhanced appreciation of balancing on territories. When you hover with the mouse over the graph display for a territory, a value label appears and the territory is highlighted in the table and in the map.
The graph pane is not displayed by default. See the Add a panel command to display it.
|
Note |
|---|---|
|
Different types of graph can be chosen, as a function of the number of indicators displayed:
|
- In the graph pane, on the right, click on the icon for the chosen type of graph
All imported indicators, calculated or estimated, can be represented in graphs if they are displayed in the table. Up to 3 indicators can be displayed at once.
- In the graph pane, click on the button
- Click on the drop-down menu for the added indicator
- Click on the chosen indicator
- In the graph pane, click on the X icon opposite the chosen indicator
The key indicators panel is not displayed by default. See the Add panel command to display it.
The available tiles are:
| Display | Description |
|---|---|
|
Number of territories |
Number of territories displayed in the territory assignment |
|
Number of points per territory |
Average number of points in territories |
|
Number of visits by territory |
Average number of visits per day and per territory over the total duration of the study, as defined in the KPI parameters and taking account of frequencies. |
|
Workload |
Workload, or feasibility: Theoretical total time needed to complete all visits compared with theoretical total working time (Number of days worked X Number of hours per day in KPI parameters). |
|
Maximum distance |
Maximum distance to the furthest point for each territory. |
|
Maximum travel time |
Maximum travel time to the furthest point in time for each territory. |
|
WD (Weighted Distribution) |
Percentage of sales for the selection compared with total sales for the study (sales turnover in KPI parameters). |
|
Face to face |
Time spent working face-to-face versus time spent commuting. |
- In the KPI panel, click on Settings.
- Click on the switch button opposite the tile to be displayed
- Click on Save
- Drag and drop the tile into the panel
- Click on Edit
- In the KPI panel, click on Edit
- Position the cursor on the bottom right-hand corner of the tile to be resized.
- Drag and drop to desired size
- Click on Edit
The following key indicators can be configured:
| Indicator | Parameter |
|---|---|
|
Number of visits by territory |
Number of days worked |
|
Workload |
Total time worked (Indicator), Number of hours worked per day and Number of days worked. |
|
WD (Weighted Distribution) |
Sales CAGR (Indicator) |
|
Face to face |
Time spent working face-to-face versus time spent commuting. |
- In the KPI panel, click on Settings.
- Click on the switch button opposite the tile to be displayed
- Enter value or specify indicator for selected parameter(s)
- Click on Save
